(A prelude to aggregate models and policy decisions)
Classical School
Also called
- neo-classical, supply-side
Major Thinkers
- Adam Smith (Wealth of Nations)
- David Ricardo
- Thomas Malthus
- Alfred Marshall
- Jean-Baptiste Say
Basic Paradigm: competition is good
- forces firms to improve.
- Causes them to lower prices to earn market share
- Invisible hand - pushes the market forward
- For the consumer: better product at lower prices over time
- Forces bad firms to improve or get out
- New companies must be more efficient to compete
Say's law: Supply creates its own demand in the long run.
- economy will not only improve but balance itself.
- If suppliers overproduce, they create a surplus, they cut production and lower prices. You will recover once you flush out the surplus. Real wealth is in balance.
- Shortage? Increase production. Raise prices. Hire more people. Raise wages. Real wealth stays the same.
 Governments role = limited

- Ensure competition occurs. - forms cartels, trusts. Businesses can cheat.
- Monopolies stop completion
- Unions - anti competitive. Stops firms from being able to adjust to wage changes. They can break down the fundamental Competitive process. Firms need to be flexible with wages at times.
Modern Policy Examples:

- Trickle Down tax policies. Lower taxes on the rich. They control industry and when they profit more, they will build more industries. More workers will be hired. Everyone will benefit.
- Lower taxes on businesses and individuals. This will help production and consumption and make industry more efficient.
- Reduce power of groups like inefficient unions that block wage adjustments and
flexibility. Create more “Right to Work” laws.
- Support more free trade like the EU, NAFTA, CAFTA, and the WTO
- Get rid of socialistic, anti-competition parts of the economy.
- Lower tax revenues that the government can collect in order to minimize the way government can afford to interfere in the economic markets.
Sum: in the long run, the economy will balance.
Riccardo adds international trade to this.

- Free trade.
- The more you trade the more competitive the world market becomes
- the more interlinked it will become, the more efficient it becomes.
Then what happened?
 Great Depression
Keynesian economics
- Demand-side
- John Maynard Keynes
- Neo-Keynesian,
- Fiscal Policy
- Modern guy is Krugman.
Basic Paradigm: Competition is good but flawed.
- It's never going to balance itself.
- Gov. Has to balance it.
- The invisible hand is inefficient.
 Says says law is a myth. There is no natural balance.

- Businesses can't really lower prices at will. - sticky prices.
- Paradox of thrift. - people will always save some of their income. Says its a leak.
- Prices can increase but not decrease. - the ratchet effect
- Inefficiencies will bring you down eventually.
- Recessions will be the norm and government must step in.
Government Role

- must now step in and correct the missing Aggregate demand
- Congress will represent the interests of the people and will use the tools of taxes and spending.
Fiscal Policy
- When recessions occur, governments spend. (also a ratchet effect)
- Increase taxes and cut spending. - affect Aggregate demand
- Automatic stabilizers - progressive tax, social security, unemployment insurance.
- In the long run we're all dead.
 Modern Policy Examples
- Countercyclical Fiscal Policies like tax cuts during recessions.
- Social Security programs to help form a safety net for the elderly.
- Unemployment insurance benefits to help soften the blow of unemployment.
Then what happened?
Stagflation of the 1970s
Monetary policy
also refereed to as
- Federal reserve policy
- Central bank policy
 Basic Paradigm: Completion is good will be encouraged but needs constant tuning
- The more you do that the less problems you have.
Each recession has lasted about 14 months or less

- Your stimulus hits about a year after the recession started, The recession is over, you create inflation
- Even if you have good intentions you can't time it.
- Congress jumps into raising taxes and lower spending. - politicians won't do it.
- The best way to do this is through a central bank.
 Central Bank Can
- focus on inflation.
- set realistic growth targets.
- do this with interest rates and the money supply.
Lower interest rates in a recession
Raise them when dealing with inflation.
Modern Policy Examples
- Bond sales and purchases as policy tools (The Open Market Committee)
- The Fed Fund Interest Rate targets.
- The bank Discount Rate
- The bank Reserve Requirements
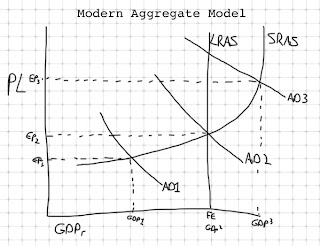
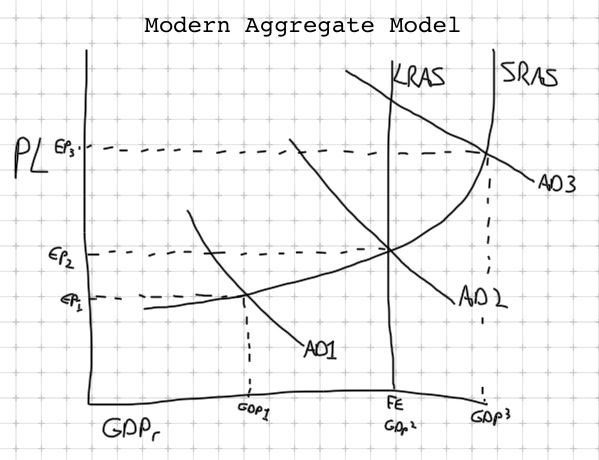
 Aggregate Models
(All parts of the economy taken as a whole)
Aggregate Models
(All parts of the economy taken as a whole)
Aggregate Demand (AD): Curve that shows the amount consumers are willing / able to buy at given price level.
 Slopes down
- Wealth Effect: as prices increase, income purchasing power falls
- Foreign Purchases Effect: as prices rise, US goods are more expensive and therefore demanded less by foreign consumers.
Shifters:
 Consumption (C) of Goods and Services by the Private Sector
- Future Expectations: How will the public react to fears of the future?
- Indebtedness: Will, or can, the public keep borrowing into the future?
- Net Income: How much money is left after paying taxes?
 Gross Investment (Ig) Businesses must first use resources before selling.

- What effect will interest rates have on business’ ability to borrow?
- What kind of expectations will business have for future profits?
- What kind of profits will exist after taxes and dividends are paid?
- How quickly can new technology be applied to better construction?
- Is there already excess capacity available for short term growth?
 Government (G)
- How much will government spend on goods and services?
Net Exports (Xn) or (X-M) (Export values minus Import values)
- Net income being sent back to the US versus Remittances from the US
- Value changes in the US Dollar and the effect on export/import prices
Aggregate demand is = ??
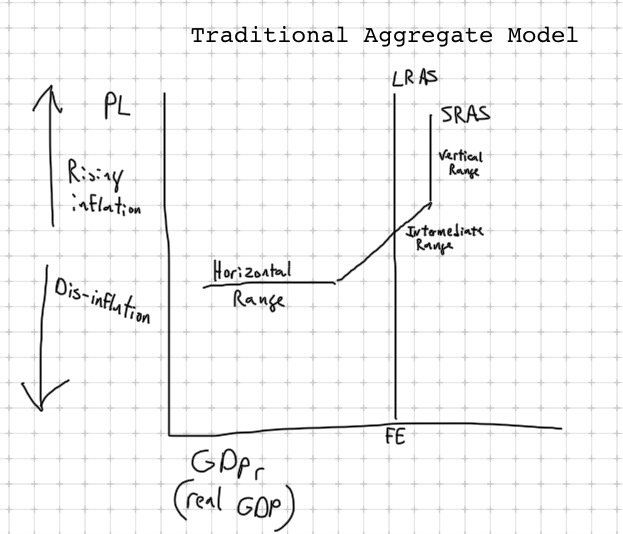
Aggregate Supply (AS): curve showing the relationship between the price level and the amount of real domestic output firms produce
Slopes up: as PL increases, GDPr increases.
 Shifters
The cost and availability of resources
Shifters
The cost and availability of resources
- The cost of paying for resources to build stuff
- How much Land, Labor, Capital, Entrep., Foreign Resources, Tech.?
Market Power/Control and Competition
- How much of the market (and pricing/profits) can this company control?
Productivity
- How efficient and productive is the labor force and the technology applied?
Gov. Regulations / Legal Environment
- What are the tax burdens on producers?
- What subsidies are available?
- What are the costs of dealing with governmental regulations?
Long Run Aggregate supply (LRAS): Measure of supply in the long run, with all resources variable.
- no relationship between PL and Q of output in the long run.
Vertical line: economy operating at efficiency.
Shifters:
- availability of resources
- changes in technology
- changes in productivity
- (equivalent to???)
(When LRAS shifts, so does SRAS)
Cover:
- Inflationary gap
- Recessionary gap
- Equilibrium
Investment decisions = marginal analysis.
marginal benefit = expected rate of return
marginal cost = interest rate (paid for borrowed $)
Firms will invest if:
expected rate of return >= interest rate
Rate of Return

- Net expected revenue - cost = profit
- profit / cost = rate of return
Example
Nice Tool Manufacturing
Possible investment: New Okuma CNC Mill
Cost: $100,000
Next Expected Revenue: $110,000
Expected Profit: ? $10,000
Expected RoR: ? .1 (10%)
Must also consider the interest rate
interest cost = principal x interest rate (i)
Let's say i = 5%
Interest cost = $5,000
Net Profit (including interest costs) = $5,000

Let's say i = 15%
Interest cost = $15,000
Interest rate > expected RoR
(15% > 10%)
Investment will be undertaken if
expected rate of return (r) => the real interest rate (i)
Investment demand graph.
- total investment demand in biz. sector (nominal interest)
- Slopes down.
- As interest lowers, demand for investment funds increases.
- Interest is a cost of doing business.
- component of GDP (Ig)
- (i = normal interest rate)
Who is demanding this investment (three big ones)
- Businesses
- Mortgages
- Student loans / education
Investment will be undertaken if
expected rate of return (r) => the real interest rate (i)
Shifts of the investment Demand Curve
1)Cost of acquiring, maintaining, and operating capital goods.
- When these costs rise, expected RoR shrinks
- Investment demand falls
- ID curve shifts to the left.
- If these costs lower / curve shifts right
2)business taxes
- firms looks at returns after taxes
- tax hike = lower expected RoR
- lower investment demand / curve shifts left
- tax cut = higher expected RoR
- higher investment demand / curve shifts right
3)Technological Changes
- new tech stimulates investment
- more efficiency lowers production costs
- new tech means new demand
- rapid increase in technology shifts the curve to the right
4)stock of capital goods on hand

- if an economy is overstocked with capital goods and finished products, expected RoR declines
- investment demand declines. (what's the point of investing?)
- curve shifts left
- if an economy is understocked with capital and finished goods,
- firms selling as fast as they can, expected RoR increces
- curve shifts right
5)business expectations
- regulation uncertainty, cost uncertainty, demand uncertainty
- if firms are optimistic about the future
- curve shifts right
- if firms pessimistic
- curve shifts left
Focus: the relationship between income and consumption (income vs. saving)
Why do we care about consumption spending?
GDP = C + Ig + G + Xn
disposable income
- Most significant factor in consumption spending
- disposable income = after tax income
- saving = disposable income - consumption
- S = DI - C
- personal saving = not spending
Assuming room for growth...
More spending = higher GDP
More saving = lower GDP
Average Propensity to consume (APC)
- The average of what people will consume.
- % or fraction of total income consumed
- APC = Consumption / income
Average propensity to save (APS)
- The average of what people will save.
- % or fraction of total income saved
- APS = savings / income
APC + APS will always = one.
Marginal Analysis
What happens when a new DI is added?
Marginal propensity to consume
- What % of new DI will people consume (spend)
- MPC = change in consumption / change in income
Marginal propensity to save
- What % of new DI will people save.
- MPS = change in saving / change in income
MPC + MPS will always = one.
Spending Multiplier Effect: a change in
a component of total spending leads to a
larger change in GDP.
- any initial change in spending will set off a spending chain throughout the economy
- diminishes at each step
- taken together, results in an overall change in GDP
Multiplier = 1/1-MPC
or
Multiplier = 1/MPS
- the smaller the fraction of any income saved, the greater the multiplier.
- the higher the MPC, the greater the multiplier.
 FOOD AND BEVERAGES (breakfast cereal, milk, coffee, chicken, wine, full service meals, snacks)
HOUSING (rent of primary residence, owners' equivalent rent, fuel oil, bedroom furniture)
 APPAREL (men's shirts and sweaters, women's dresses, jewelry)
TRANSPORTATION (new vehicles, airline fares, gasoline, motor vehicle insurance)
MEDICAL CARE (prescription drugs and medical supplies, physicians' services, eyeglasses and eye care, hospital services)
 RECREATION (televisions, toys, pets and pet products, sports equipment, admissions);
EDUCATION AND COMMUNICATION (college tuition, postage, telephone services, computer software and accessories);
OTHER GOODS AND SERVICES (tobacco and smoking products, haircuts and other personal services, funeral expenses).
From Bureau of Labor Statistics


 Governments role = limited


 Says says law is a myth. There is no natural balance.

 Modern Policy Examples
 Basic Paradigm: Completion is good will be encouraged but needs constant tuning
 Central Bank Can


