Balance of payments (BoP) accounts: an accounting record of all monetary transactions between a country and the rest of the world
These include:
Current Accounts
Goods: Consumer, Capital, Agricultural
Services: Receipts versus Payments
(includes Travel, Royalties, License Fees)
Capital / Financial Accounts
“Net Capital Account Payments”
Assets: Purchases of Securities, Direct Investment Payments
Official Reserve Assets
Why keep track of this?
- To establish the ability to balance accounts and trade in the future
- Fixed vs. floating exchange rates
Individuals and Businesses record stuff like...
- Job income, interest income, consumption payments, investment payments
So nations are expected to keep track of this responsibly
- Why? helps stabilize currencies and trade expectations for future investments
International BOP can be summarized as a ledger sheet for each trading nation.
- Current Account keeps track of the difference between a country's total exports and total imports. (physical stuff, services, investment income, transfers)
- trade deficit = importing more than you export (Xn is a negative number)
- trade surplus = exporting more than you import (Xn is a positive number)
- Capital Account (sometimes called the Financial Account) keeps track of ownership of assets. (foreigners who own US assets and US citizens who own foreign assets)
Terms:
Current Account (CA): An immediate and final transaction
CA Net Exports Export values minus Import values
CA Balance of Trade (Goods and Services)
CA Balance on Goods & Services Tourism Expenditures
CA Trade Balance
- CA Net Investments: Payments on prior stock and bond investments like dividend payments
- CA Net Transfers: Aid, Transfers and Remittances, Royalty Payments
Capital and Financial Account (KA): Purchases and payments are made that hope to create future revenues and obligations (people buy stuff as an investment)
- KA Real and Financial Assets: Stocks, Bonds, Land, Companies, Franchises, ….
Reserves: Used to balance out accounts if Current Accounts don’t equal Capital and Financial Accounts
- Official Reserves: Gold and Currency Holdings
- Official Settlements: Also Gold and Currency Holdings
- Special Drawing Rights at the IMF: Funds held by the International Monetary Fund
BOP Assets or Credits: A positive number for a nation
- Currency Inflows: Wealth amounts coming into a country as a result of the transaction
- Currency Demand: Wealth amounts are therefore demand for the currency of the country
BOP Liabilities or Debits: A negative number for a nation
- Currency Outflows: Wealth amounts leaving a country as a result of the transaction
- Currency Supply: Wealth amounts are therefore supply of the currency moving out of the country
A Final Word on Balances
- There is constant news and discussion about the USA’s massive and increasing Trade Deficit.
- This is most obvious in the imbalance of imports versus exports,
- the US imports hundreds of billions more annually that it exports.
 The two major culprits are usually:
- oil imports
- trade with China.
We do export lots of items,

- mostly heavy equipment and services
- but those amounts do not equal the oil imported and the lack of ability to sell goods to China. (right now)
what really occurs
- oil producing nations and China turn around and use lots of the extra dollars they receive and invest in US stocks and bonds (Capital and Financial Account Asset for the US).
People in the US worry when
- China tries to buy stuff like US car companies
- US ports (blocked by the government)
- China tries to buy the panama canal
- resource rich areas in Africa
Currencies as part of Supply and Demand

- All major currencies of the world “float” on supply and demand markets.
- Some minor currencies are “pegged” to other major currencies like the
- US dollar and the Euro,
- but rise and fall in value with those major currencies.
- The only major currency that is “fixed” in exchange rates by governmental decree is the People’s Republic of China’s Yuan.
- The Chinese government does adjust the “fixed” rate occasionally,
- most recently as a response to US pressure to balance trade issue flaws.
- Currencies either “appreciate” or “depreciate” in EP.
When changes occur between two countries’ economies, the currencies will reflect those changes:
- When other countries want something from us they are demanding dollars.
- When we want something from other countries we are supplying dollars.
 three rules of currency demand graphs
- Always change the D line on one currency graph, the S line on the other currency’s graph.
- One currency will appreciate, the other will depreciate.
- Move the lines of the two currency graphs the same direction and you will end up with the correct answer.
How do currencies move?
- Fads, tastes, and political actions like boycotts, occur in a country as it deals with another country.
- The country with less inflation has the more attractive economy compared to a trading partner.
- The country with better investment opportunities (higher real interest rates for investments) has the more attractive economy.
- The country “expected” to improve its economic standing more quickly than trading partners will have the more attractive economy.
- If the overall real wealth of one country improves, compared to the wealth of a trading partner, the improving country will have the more attractive economy.
Economic growth
(A percentage rate of growth per quarter)

- increase in real GDP
- (or)
- increase in real GDP per capita
- real GDP / population, compared to previous quarters
growth lessens the burden on scarcity
Rule of 70: provides a mathematical grasp of the effect of economic growth rate changes.
- Number of years for variable to double = 70 / Annual Growth Rate of the Variable
Why do we see growth in some areas and not in others?
Institutions that promote growth
- strong property rights
- patents and copyrights
- efficient financial institutions
- widespread education
- free trade
- competitive market system
Non-institutional factors
(supply) increase in:
- quantity and quality of natural resources
- quantity and quality of human resources
- stock of capital goods
- advances in technology
(demand) increases in:
(efficiency) increase in:
- allocative efficiency
- productive efficiency
Discussion: is growth desirable?
Major points:
- high tax rates

- reduce incentives to work, save, and invest.
- impede the long run growth of aggregate supply
- (rewards of working vs. leisure / saving vs. consuming are reduced)
- There's a range were the tax rate will discourage people from doing things with their money.
Things to consider:
- value of work
- value of leisure
- after-tax revenue
The curve suggests:

- High tax rates will lead to less overall tax revenue
- lower tax rates will increase overall tax revenue

- lower rates encourage saving and investing
- people have an incentive to substitute work for leisure
- firms have better equipment (improves productivity)
- rise in labor productivity expands LRAS
- unemployment and inflation rates low
Internationally...
- firms are doing more "tax shopping".
- People and businesses headquarter in places with low tax rates.
- the government in the home country is loosing all of their tax revenue from that business or person.
The Original Short Run Phillips Curve
Basic Assumptions:
- inverse relationship between inflation and unemployment.
- When one increases, the other decreases.
- If an economy has inflation,
- usually due to demand pull growth
- more workers are being hired to produce the greater number of goods being produced.
- If an economy is in a recession,
- more resources are being left idle
- fewer workers are needed and less pressure is put on the resource base.
- This results in less inflation.
Movement along the Phillips Curve represents year to year
changes in the business cycle.
- The original data collected in the 1940’s and 1950’s showed this general connection with the business cycle. This also held during the 1960’s in the US (see most texts).
The Problem of Stagflation
(Phillips Curves under attack:)
- Starting in the mid-1970’s the economy started to suffer from increasing amounts of inflation and unemployment
- The data points on the Phillips Curve no longer fit into any immediately recognizable pattern.
- Did the model seem to present the relationship between inflation and unemployment too simplistically?
A New “Phillips” Approach
Stagflation, and its removal, explained:
- If the fundamental efficiencies and demographics of an economy change, then the relationship between inflation and unemployment is still valid, just in a new range.
- One key change is the type of inflation.
- If inflation now becomes “cost push” inflation, the resource
base has now changed.
- The aggregate supply is reduced due to resources being used up or lost, disasters, boycotts, etc.
- More costs and job losses occur.
- The result of cost push inflation will be higher
prices due to
fewer and more expensive resources, plus more unemployment
due to business production cuts.
- This is also known as a supply shock.
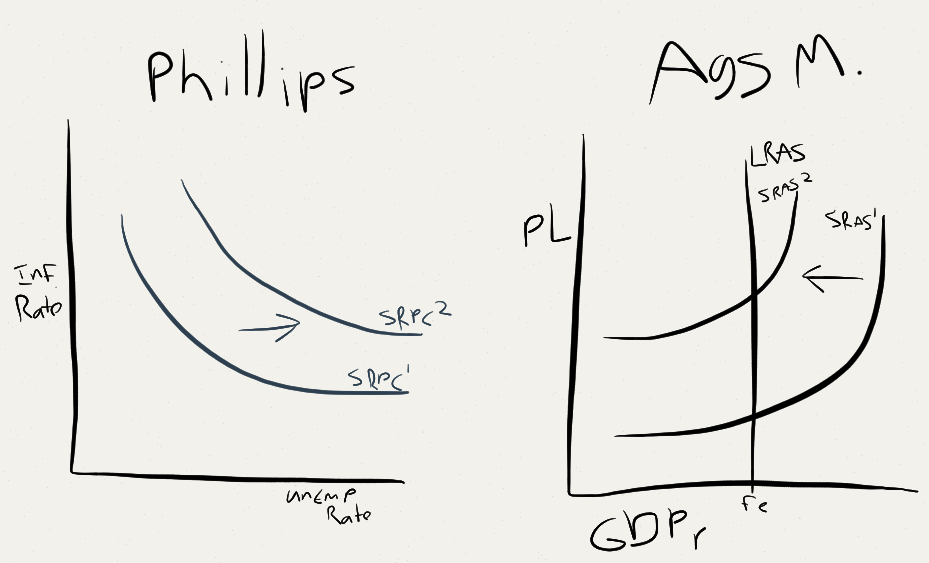
The Short Run Phillips Curve still has a relationship between the two factors, but the curve moves outward.

- Year to year business cycles still occur, just at higher levels than before.

- When the economy is able to adjust with improved
technologies, or the resource supply is re-established, the inflation
pressures level off and businesses are able to lower costs and produce
more. The SRPC moves back inward (to the left).
This approach appears to answer the late 1970’s changes.
- As energy resources were cut and significant
demographic changes like women moving into the workforce changed, the
economy suffered from stagflation.
- This was “cured” by the restoration of cheaper energy and new technologies in the 1980’s and 1990’s.
- The logic of the Phillips Curve was intact, just in new ranges.
The Long Run Phillips Curve
 Inflation has less importance in the Long Run.
Two new factors emerge in Long Run analysis.

- the economy can adjust for inflation in the long run through wage and real-wage changes.
- Rational Expectations School theories that expected
inflation rates are controllable and predictable by the market,
therefore no longer a random factor.
The Long Run Phillips Curve is therefore vertical at some natural rate of unemployment.

- now presumed to be around 4 to 5 % for the US and 6% for Canada.
- This vertical LRPC is also known as the NAIRU line, or “non accelerating inflation rate of unemployment”.
The analysis of the LRPC
- based on arguments of how a country can change the natural rate of unemployment.
- connected to long run productivity of the workforce and the willingness of a country to help those who are unemployed.
- The theory is that financial assistance given to
those who lose jobs will lengthen their “willingness” to wait, or
settle, for new jobs.
- This will increase the natural rate of unemployment (move it to greater levels of unemployment).
The Phillips Curve and the AD/AS Model
Phillips Curves and AD/AS Graphs: Mirror Images
- When you move points along the SRPC you are showing changes in the year to year business cycle.
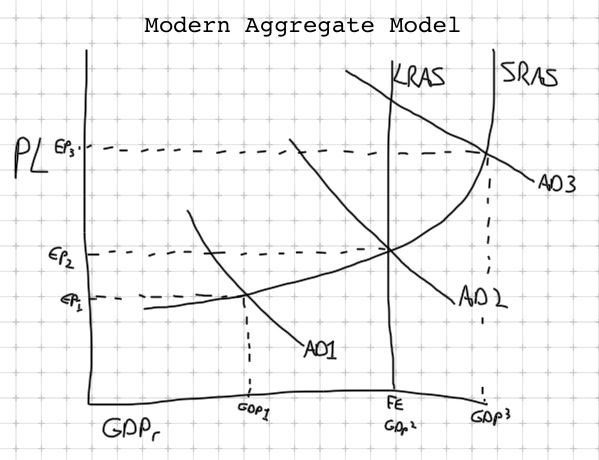
- This is exactly what you are illustrating when you move the AD line on the AD/AS model.
- When you move the entire SRPC outward to show supply
shocks or cost push inflation problems, it is exactly the same at moving
the SRAS curve inward.
- The AD/AS model will also show the simultaneous creation of greater inflation and more unemployment.
- This will also be true of movements in the opposite
directions, like the SRPC moving back inward is the same as the SRAS
curve moving outward to better levels of inflation and production.
Timing
Recognition lag
- time between a recession beginning and knowing it is happening (why?)
- time it takes to recognize the price level has risen
Administrative lag
- democratic government is slow
- it's supposed to be!
Operational lag
- time between the action being taken and the desired affects taking place
- tax changes are relatively fast
- spending changes are not (example: public works)
- (consequence: tax changes a more common tool)
Politics
- government dollars tend to create constituencies for those dollars
- political incentives (reelection)
- actions may be taken in the guise of fiscal policy
- political business-cycles
- political uncertainty (fear of future policy reversals)
- offsetting state and local finance