Basic Assumptions:

- inverse relationship between inflation and unemployment.
- When one increases, the other decreases.
- If an economy has inflation,
- usually due to demand pull growth
- more workers are being hired to produce the greater number of goods being produced.
- If an economy is in a recession,

- more resources are being left idle
- fewer workers are needed and less pressure is put on the resource base.
- This results in less inflation.


- The original data collected in the 1940’s and 1950’s showed this general connection with the business cycle. This also held during the 1960’s in the US (see most texts).
(Phillips Curves under attack:)
- Starting in the mid-1970’s the economy started to suffer from increasing amounts of inflation and unemployment
- The data points on the Phillips Curve no longer fit into any immediately recognizable pattern.
- Did the model seem to present the relationship between inflation and unemployment too simplistically?
Stagflation, and its removal, explained:

- If the fundamental efficiencies and demographics of an economy change, then the relationship between inflation and unemployment is still valid, just in a new range.
- One key change is the type of inflation.
- If inflation now becomes “cost push” inflation, the resourcebase has now changed.

- The aggregate supply is reduced due to resources being used up or lost, disasters, boycotts, etc.
- More costs and job losses occur.
- The result of cost push inflation will be higher
prices due to fewer and more expensive resources, plus more unemployment due to business production cuts.

- This is also known as a supply shock.


- Year to year business cycles still occur, just at higher levels than before.

- When the economy is able to adjust with improved technologies, or the resource supply is re-established, the inflation pressures level off and businesses are able to lower costs and produce more. The SRPC moves back inward (to the left).

- As energy resources were cut and significant demographic changes like women moving into the workforce changed, the economy suffered from stagflation.
- This was “cured” by the restoration of cheaper energy and new technologies in the 1980’s and 1990’s.
- The logic of the Phillips Curve was intact, just in new ranges.
 Inflation has less importance in the Long Run.
Two new factors emerge in Long Run analysis.
- the economy can adjust for inflation in the long run through wage and real-wage changes.
- Rational Expectations School theories that expected inflation rates are controllable and predictable by the market, therefore no longer a random factor.

- now presumed to be around 4 to 5 % for the US and 6% for Canada.
- This vertical LRPC is also known as the NAIRU line, or “non accelerating inflation rate of unemployment”.

- based on arguments of how a country can change the natural rate of unemployment.
- connected to long run productivity of the workforce and the willingness of a country to help those who are unemployed.
- The theory is that financial assistance given to those who lose jobs will lengthen their “willingness” to wait, or settle, for new jobs.
- This will increase the natural rate of unemployment (move it to greater levels of unemployment).
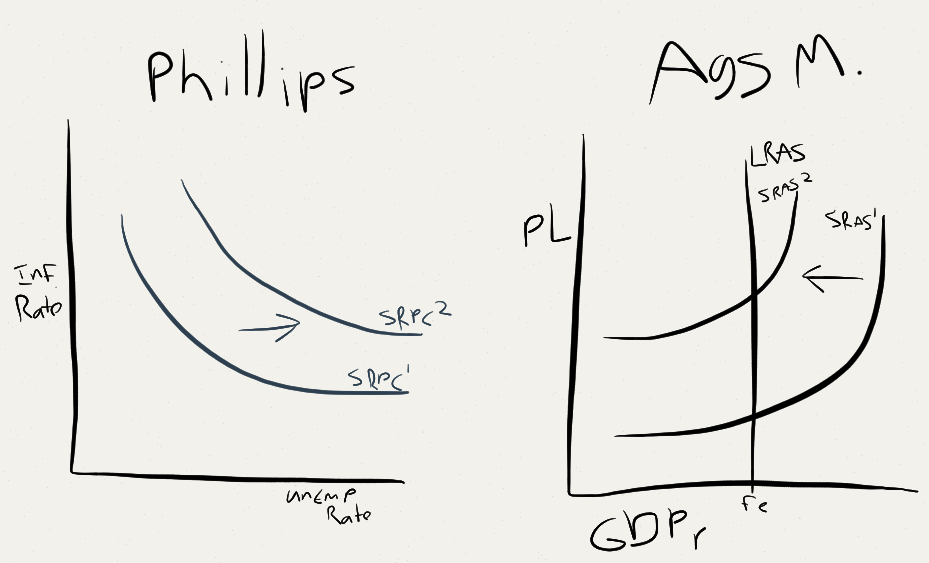
Phillips Curves and AD/AS Graphs: Mirror Images
- When you move points along the SRPC you are showing changes in the year to year business cycle.
- This is exactly what you are illustrating when you move the AD line on the AD/AS model.
- When you move the entire SRPC outward to show supply shocks or cost push inflation problems, it is exactly the same at moving the SRAS curve inward.
- The AD/AS model will also show the simultaneous creation of greater inflation and more unemployment.
- This will also be true of movements in the opposite directions, like the SRPC moving back inward is the same as the SRAS curve moving outward to better levels of inflation and production.